Report Highlights
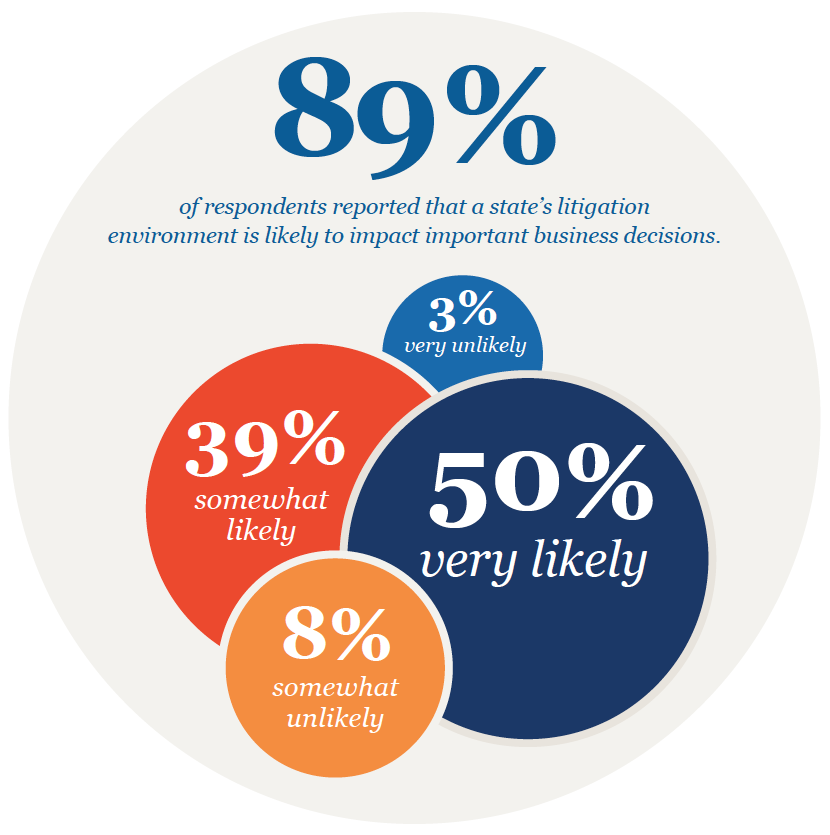
The 2019 Lawsuit Climate Survey: Ranking the States was conducted for the U.S. Chamber Institute for Legal Reform by The Harris Poll to explore how fair and reasonable the states’ liability systems are perceived to be by U.S. businesses. These perceptions matter because they can be influential in business decisions about where to conduct/expand/constrict business operations or sales. Most of the respondents in this survey (89%) report that a state’s litigation environment is likely to impact important business decisions at their companies, such as where to locate or to do business. This number has increased over time, up from 85% in 2017 and 75% in 2015.
The 2019 Lawsuit Climate Survey constitutes the twelfth fielding of the survey and builds upon previous studies, the first of which was initiated in 2002[1]. Prior to these rankings, information regarding the attitudes of the business community toward the legal systems in each of the states had been largely anecdotal. The 2019 Lawsuit Climate Survey aims to quantify how corporate attorneys, as significant participants in state courts, view the state systems by measuring and synthesizing their perceptions of key elements of each state’s liability system into a 1-50 ranking.
Participants in the survey were comprised of a national sample of 1,307 in-house general counsel, senior litigators or attorneys, and other senior executives at companies with at least $100 million in annual revenue [2]who indicated they: (1) are knowledgeable about litigation matters; and (2) have firsthand, recent litigation experience in each state they evaluate.
It is important to remember that while courts and localities within a state may vary a great deal in fairness and reasonableness, respondents were asked to evaluate the state as a whole, based on their firsthand experience with specific litigation at their company. To explore the nuances within each state would have required extensive questioning about each state and was beyond the scope and purpose of this study. It is possible that some states received low grades due to the negative reputation of one or more of their counties or jurisdictions.
The 2019 survey reveals that the overall average scores of the states are increasing, and senior attorneys and executives see the litigation environment improving generally.
The survey broadly focuses on perceptions of the state liability system by asking respondents to give states a grade (A through F) in each of the following areas:
- Enforcing meaningful venue requirements
- Overall treatment of tort and contract litigation
- Treatment of class action suits and mass consolidation suits
- Damages
- Proportional discovery
- Scientific and technical evidence
- Trial judges’ impartiality
- Trial judges’ competence
- Juries’ fairness
- The quality of appellate review
[1] 2017, 2015, 2012, 2010, 2008, 2007, 2006, 2005, 2004, 2003, 2002.
[2] Smaller companies were not surveyed because they so infrequently have in-house law departments.
2019 Study
Overall Rankings of State Liability Systems 2019 – 2015
| STATE | 2019 RANK | 2019 SCORE | 2017 RANK | 2015 RANK |
|---|---|---|---|---|
| Delaware | 1 | 76.3 | 11 | 1 |
| Maine | 2 | 73.8 | 9 | 14 |
| Connecticut | 3 | 73.8 | 16 | 22 |
| Wyoming | 4 | 73.1 | 8 | 8 |
| Alaska | 5 | 73.1 | 6 | 12 |
| North Dakota | 6 | 72.6 | 17 | 15 |
| Montana | 7 | 72.5 | 27 | 34 |
| Nebraska | 8 | 72.3 | 7 | 3 |
| Idaho | 9 | 72.2 | 3 | 6 |
| South Dakota | 10 | 72.0 | 1 | 9 |
| Vermont | 11 | 71.7 | 2 | 2 |
| Virginia | 12 | 71.3 | 10 | 11 |
| Wisconsin | 13 | 71.2 | 20 | 20 |
| Oklahoma | 14 | 71.2 | 31 | 33 |
| Hawaii | 15 | 71.1 | 23 | 30 |
| North Carolina | 16 | 70.9 | 33 | 7 |
| Arizona | 17 | 70.8 | 25 | 25 |
| New Hampshire | 18 | 70.7 | 5 | 5 |
| Utah | 19 | 70.7 | 12 | 10 |
| Minnesota | 20 | 70.7 | 4 | 13 |
| Colorado | 21 | 70.7 | 35 | 16 |
| New Mexico | 22 | 70.6 | 32 | 45 |
| Iowa | 23 | 70.6 | 13 | 4 |
| Rhode Island | 24 | 70.5 | 24 | 26 |
| Oregon | 25 | 69.9 | 21 | 32 |
| Washington | 26 | 69.8 | 28 | 29 |
| Maryland | 27 | 69.7 | 19 | 28 |
| Massachusetts | 28 | 69.6 | 14 | 17 |
| Nevada | 29 | 69.5 | 37 | 35 |
| Arkansas | 30 | 69.5 | 36 | 41 |
| Indiana | 31 | 68.9 | 15 | 18 |
| Kansas | 32 | 68.8 | 18 | 19 |
| Michigan | 33 | 68.8 | 22 | 24 |
| Tennessee | 34 | 68.3 | 30 | 23 |
| Ohio | 35 | 67.7 | 26 | 27 |
| New York | 36 | 67.7 | 29 | 21 |
| South Carolina | 37 | 67.6 | 34 | 36 |
| Texas | 38 | 67.1 | 39 | 40 |
| Pennsylvania | 39 | 66.6 | 38 | 37 |
| Kentucky | 40 | 66.5 | 42 | 39 |
| Georgia | 41 | 66.1 | 40 | 31 |
| Alabama | 42 | 65.6 | 43 | 46 |
| New Jersey | 43 | 65.4 | 41 | 38 |
| Missouri | 44 | 64.4 | 49 | 42 |
| West Virginia | 45 | 63.3 | 45 | 50 |
| Florida | 46 | 62.3 | 46 | 44 |
| Mississippi | 47 | 61.9 | 44 | 43 |
| California | 48 | 60.2 | 47 | 47 |
| Louisiana | 49 | 60.0 | 50 | 49 |
| Illinois | 50 | 59.6 | 48 | 48 |
Scores presented in this table have been rounded to one decimal place, but rankings are based on the unrounded number.
Note that due to changes in overall ranking criteria in 2017, the rankings from 2019 do not provide an exact apples-to-apples comparison to years prior to 2017; however, prior scores are provided for historical reference.
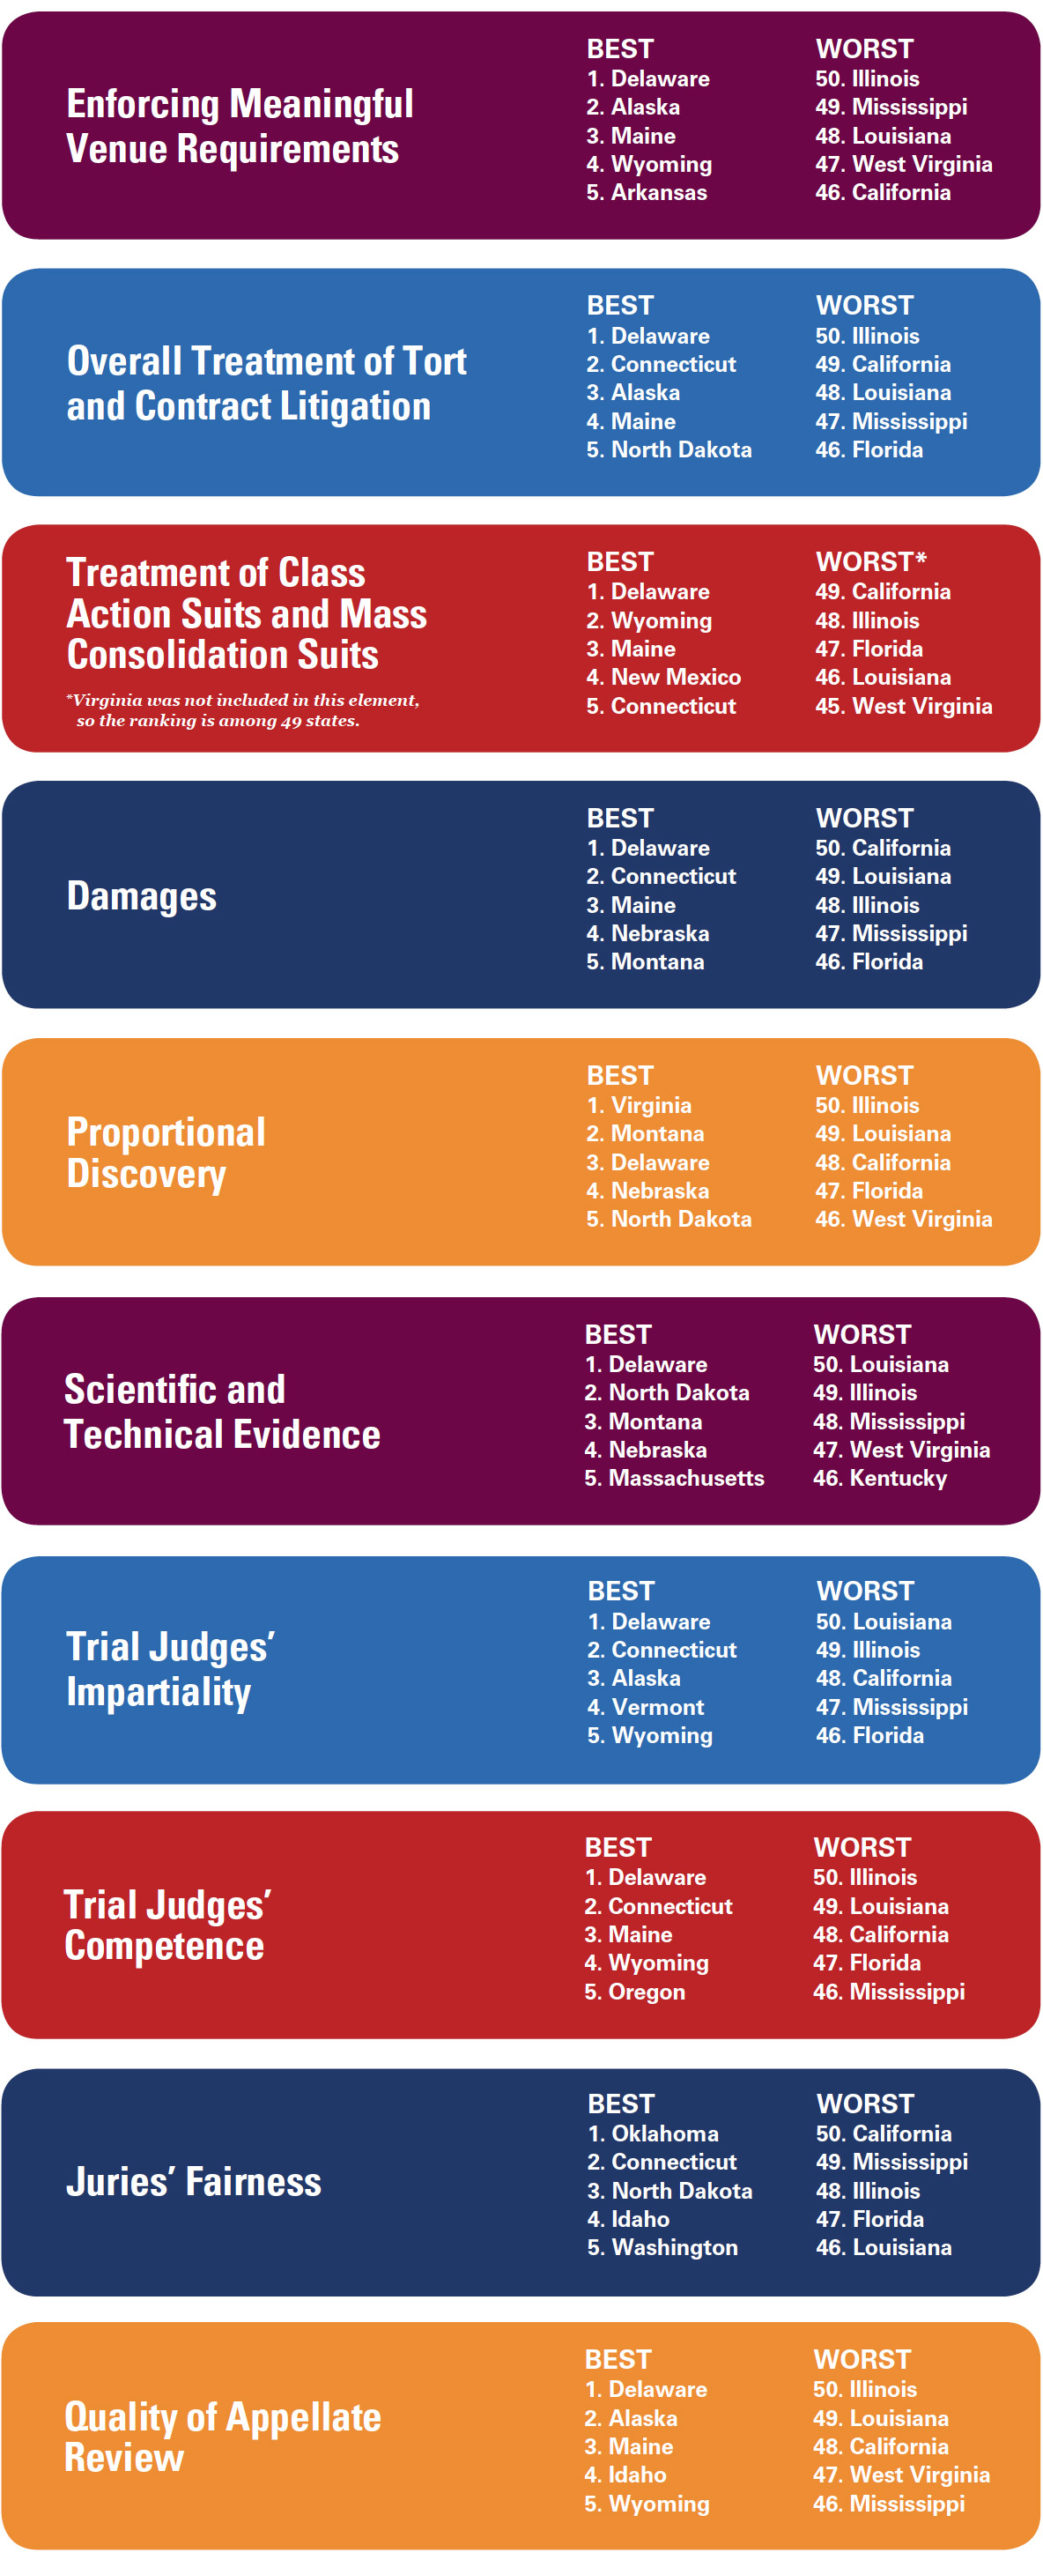
Summary of Top/Bottom 5 States by Key Elements
Impact of Litigation Environment on Important Business Decisions
Cities or Counties with the Least Fair and Reasonable Litigation Environment*
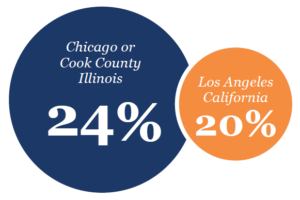
| Chicago or Cook County, Illinois | 24% |
| Los Angeles, California | 20% |
| San Francisco, California | 19% |
| New York, New York | 18% |
| Jefferson County, Texas | 14% |
| Miami or Dade County, Florida | 13% |
| Detroit, Michigan | 13% |
| Washington, DC | 12% |
| New Orleans or Orleans Parish, Louisiana | 10% |
| St. Louis, Missouri | 10% |
| Madison County, Illinois | 9% |
| Philadelphia, Pennsylvania | 9% |
| Not sure | 6% |
| Other | 2% |
| Decline to answer | < .05% |
*Respondents were asked to respond to this closed-end list of city and county courts by selecting up to two responses. Other mentions volunteered by respondents are represented by “Other” in the list. The total number is greater than 100% due to the fact that this was a multiple-response question.
An Overview
The 2019 Lawsuit Climate Survey: Ranking the States was conducted for the U.S. Chamber Institute for Legal Reform by The Harris Poll. The final results are based on interviews with a national sample of 1,307 in-house general counsel, senior litigators or attorneys, and other senior executives who are knowledgeable about litigation matters at public and private companies with annual revenue of at least $100 million.
The general counsel, senior litigators or attorneys, and other senior executives included in this study were involved in or are very familiar with litigation in the states they evaluated within the past five years. On average, each telephone respondent evaluated four states, and each online respondent evaluated seven states.[1] As a result, these 1,307 individual respondents represent a total of 8,423 responses or state evaluations.
Phone interviews averaging 19 minutes in length were conducted with a total of 202 respondents and took place between March 28, 2019 and June 24, 2019. Online interviews using the same questionnaire and averaging 15 minutes in length were conducted with a total of 1,105 respondents and took place between March 27, 2019 and June 21, 2019.
Sample Design
For the telephone sample, a comprehensive list of general counsel at companies with annual revenue of at least $100 million was compiled using Hoovers Phone, InfoUSA, and Leadership Directories, as well as a list of U.S. Chamber Institute for Legal Reform (ILR) donors. An alert letter was sent to the general counsel at each company when possible. This letter provided general information about the study and notified the recipient of the option to take the survey online or by phone. It told them that an interviewer from The Harris Poll would be contacting them to set up an appointment for a telephone interview if that was their preference.
The letter included a toll-free number for respondents to call to schedule an appointment for a telephone interview. It also alerted the general counsel to a $100 incentive in the form of a gift card or charitable donation given in appreciation of the time invested in taking the survey.
For the online sample, the e-mail addresses for a representative sample of general counsel and other senior attorneys were drawn from Hoovers ConnectMail, Critical Mix, SSI/Research Now, Empanel, Precision, and Leadership Directories, as well as a list of ILR donors. Non-panel respondents received an electronic version of the alert letter, which included a password-protected link to take the survey. Once they accessed the survey online, all respondents were screened to ensure that they worked for companies with more than $100 million in annual revenue and they had the appropriate title or role within the company.
Sample Characteristics
Over a third of respondents (35%) were general counsel, corporate counsel, heads of litigation, senior counsel/litigators, or chief legal officers. The remaining 65% of respondents were senior executives knowledgeable about or responsible for litigation at their companies. Respondents had an average of 14 years of relevant experience with litigation at their companies, including in their current position. All respondents were familiar with or had litigated in the states they rated within the past five years, the majority (70%) within the past three years.
Telephone Interviewing Procedures
The telephone interviews utilized a computer-assisted telephone interviewing (CATI) system, whereby trained interviewers call and immediately input responses into the computer. This system greatly enhances reporting reliability. It also reduces clerical error by eliminating the need for keypunching, since interviewers enter respondent answers directly into a computer terminal during the interview itself. This data entry program does not permit interviewers to inadvertently skip questions, as each question must be answered before the computer moves on to the next question. The data entry program also ensures that all skip patterns are correctly followed. Furthermore, the online data editing system refuses to accept punches that are out of range, demands confirmation of responses that exceed expected ranges, and asks for explanations for inconsistencies between certain key responses.
To achieve high participation, in addition to the alert letters, numerous telephone callbacks were made to reach respondents and conduct the interviews at a convenient time. Interviewers also offered to send respondents an e-mail invitation so that respondents could take the survey online on their own time. All phone interviewers participated in several sessions of rigorous training to ensure they were properly prepared to conduct interviews with the survey’s high level audience.
Online Interviewing Procedures
All online interviews were hosted on The Harris Poll’s server and were conducted using a self-administered, online questionnaire via proprietary web-assisted interviewing software. The mail version of the alert letter directed respondents to a URL and provided them with a unique ID and password that they were required to enter on the landing page of the survey. Those who received an e-mail version of the alert letter accessed the survey by clicking on the password-protected URL included in the e-mail. Due to password protection, it was not possible for a respondent to answer the survey more than once. Respondents for whom we had e-mail addresses received an initial invitation as well as reminder e-mails.
Interviewing Protocol
After determining that respondents were qualified to participate in the survey using a series of screening questions, respondents identified the state liability systems with which they were familiar. The respondents were then asked to identify the last time they litigated in or were familiar with the states’ liability systems; responses included in this study were from respondents who were involved in or very familiar with litigation in the state within the past five years. From there, respondents were given the opportunity to evaluate the states’ liability systems, prioritized by their most recent litigation experience. As stated earlier, respondents evaluated four states, on average, via telephone and seven states, on average, online.
Rating and Scoring of States
States were given a grade (A through F) by respondents for each of the key elements of their liability system, providing a rating of the states by these grades, the percentage of respondents giving each grade, and the mean grade for each element. The mean grade was calculated by converting the letter grade using a 5.0 scale, where A=5.0, B=4.0, C=3.0, D=2.0, and F=1.0. Therefore, the mean score displayed can also be interpreted as a letter grade. For example, a mean score of 2.8 is roughly a C- grade.
The Overall Ranking of State Liability Systems was developed by creating an index using the grades provided for each of the key elements. To create the index, each grade across the elements was rescaled from 0 to 100 (A=100, B=75, C=50, D=25, and F=0). Then, any evaluation that contained six or more “not sure” or “decline to answer” responses per state was removed. A total of 1% of state evaluations were unusable. From the usable evaluations, the scores on the elements were then averaged to create the index score from 0 to 100.
The scores displayed in this report have been rounded to one decimal point, but rankings are based on the full, unrounded number. States that appear tied based upon the scores in this report were tied when the unrounded numbers were taken into consideration.
For the Rankings on Key Elements (pages 13–22), a score was calculated per element for each state based on the 0 to 100 rescaled performance grades. The states were then ranked by their mean scores on that element.
Reliability of Survey Percentages
The results from any sample survey are subject to sampling variation. The sampling variation (or error) that applies to the results for this survey of 1,307 respondents is plus or minus 2.7 percentage points. That is, the chances are 95 in 100 that a survey result does not vary, plus or minus, by more than 2.7 percentage points from the result that would have been obtained if interviews were conducted with all persons in the universe represented by the sample. Note that survey results based on subgroups of smaller sizes can be subject to larger sampling error.
Sampling error of the type so far discussed is only one type of error. Survey research is also susceptible to other types of error, such as refusals to be interviewed (non-response error), question wording and question order, interviewer error, and weighting by demographic control data. Although it is difficult or impossible to quantify these types of error, the procedures followed by The Harris Poll keep errors of these types to a minimum.
[1] The number of evaluations was rounded to the nearest whole number. Partial evaluations of states were not included.